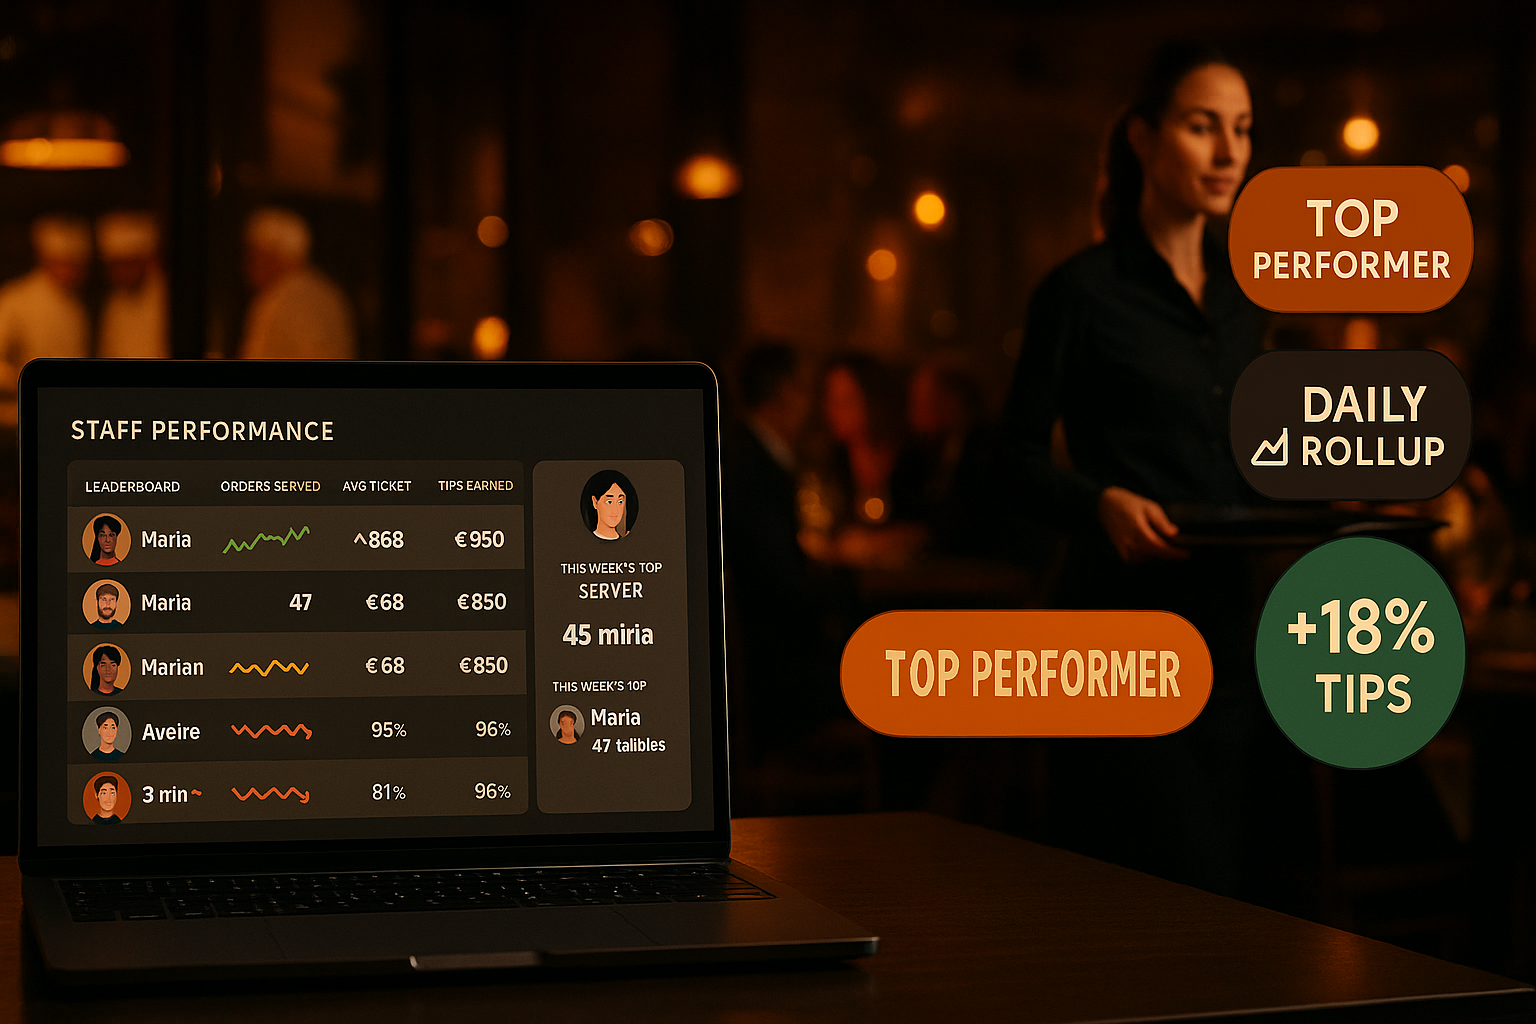
Staff Performance — Daily metrics that surface real coaching moments
Per-staff dashboards with orders served, average ticket, on-time rate, voided items, and customer feedback — rolled up nightly from your live order data, not from a separate POS export.
What is staff performance tracking?
Staff performance in Ordering.Tools is a daily roll-up of every metric that ties a staff member to a customer or a shift: orders they served, items they fired, revenue they were responsible for, average ticket size, on-time vs late vs no-show shifts, voided items, and average customer feedback rating. Every metric comes from data the platform already captures (Order.assignedWaiterId, OrderFeedback, ClockEvent, StaffShiftAssignment). The roll-up runs nightly via the cron:nightly runner; managers can replay any window from the admin UI.
The point isn't surveillance — it's coaching. Per-staff dossiers surface the patterns that matter: who's consistently early; who has the highest avg ticket; who voids more than peers; who shows up on time even on a Saturday after a wedding. Pair this with the rota grid and managers know who to schedule for the lunch rush vs the late-night patio shift. The data is read-only for managers (no editing of past metrics); raw events live in the audit log if anyone needs to verify.
Why per-staff dashboards beat 'overall sales'
Source from your own order data
Every metric is computed from rows you already have — Order, OrderFeedback, ClockEvent, StaffShiftAssignment. No extra sensors, no separate POS export, no third-party time-tracking integration. Order.assignedWaiterId is the join key.
Nightly roll-up + on-demand replay
The roll-up runs at 03:00 UTC (cron:nightly) and writes one StaffMetricsDaily row per (venue, staff, date). If you need to recompute a window — say after a backfill — hit /api/admin/staff/metrics/replay with a from/to range; the upsert is idempotent.
On-time vs late vs no-show
We compare the staff's CLOCK_IN against their scheduled StaffShiftAssignment.startTime. Within 5 minutes = on-time; over 5 minutes = late; no clock-in by end of shift = no-show. Per-staff rolling averages surface the pattern, not just the bad night.
Read-only by design
The metrics aren't editable — managers can't 'fix' a row to be more flattering. The raw events live in the audit log and are reproducible. If you spot a row that looks wrong, the replay endpoint recomputes it; if the recompute matches, the data is real.
How performance tracking works
Enable the feature flag
Toggle enableStaffMetrics in Staff → Settings. The nightly cron starts emitting rolled-up metrics within 24 hours; the per-staff dossier tab in /admin/profile becomes visible to the staff member.
Nightly roll-up runs
At 03:00 UTC the cron:nightly runner executes the staff-metrics step. It groups Order rows by assignedWaiterId for each enabled venue, joins ClockEvents for hours, aggregates OrderFeedback for ratings, and upserts one row per (venue, user, date).
Managers see the dossier
Open Staff → Members → click a staff member. The dossier shows daily metrics over the last 30/90 days with sparklines for orders, revenue, and feedback average. Click any day to see the underlying StaffShiftAssignment + ClockEvents + Orders.
Staff see their own stats
Each staff member sees their own metrics from the My Stats screen on the mobile waiter shell — read-only. Coaching conversations are framed by data both sides can see, not by anecdote.
Staff Performance — feature deep-dive
Daily roll-up via cron:nightly
Idempotent upsert — re-running the same window produces identical rows. The roll-up is part of the cron-system-migration grouped runner architecture; new metrics are added by extending one step, not creating a new cron line.
- Runs at 03:00 UTC alongside cashback-expire and customer-stats
- Idempotent — replay any window without duplicates
- Skips venues with enableStaffMetrics = false
- Per-venue isolation: failures in one venue don't block others
On-time / late / no-show classification
We compare the staff member's first CLOCK_IN of the day to the StaffShiftAssignment.startTime. Late threshold is configurable (default 5 minutes); no-show is no clock-in by end of shift. The classification writes onTimeShifts / lateShifts / noShowShifts counters.
- Configurable late threshold per venue
- Tolerant of multiple shifts per day (uses earliest match)
- Skips shifts with status = CANCELLED
- Time-off-approved shifts don't count as no-show
Customer feedback aggregation
OrderFeedback rows joined to Order.assignedWaiterId give per-staff customer ratings. The dossier shows feedbackAvg + feedbackCount; clicking through reveals individual comments (when present) so coaching has concrete examples.
- Average rating across all rated orders in the period
- Comment surfacing for coaching conversations
- Distinguishes 'no feedback' from 'low feedback'
- Filters out anonymous bulk-spam ratings via the existing review-trust pipeline
Manager replay endpoint
If a backfill or a bug means past metrics are wrong, hit /api/admin/staff/metrics/replay with from/to. The endpoint re-runs the same logic the nightly cron uses; the upsert overwrites stale rows with fresh ones.
- Authenticated + permission-gated (staff.manage)
- Idempotent — safe to call multiple times
- Optional venueId scope — replay just one venue at a time
- Returns scanned/written/error counts in the response
Where staff metrics drive better decisions
Coaching the new hire
A waiter hired three months ago has feedbackAvg = 3.8 vs the team average of 4.4. Open their dossier — the bad ratings cluster on Saturday late-night shifts. The manager pairs them with a senior on those shifts; the average climbs to 4.3 over the next month.
Spotting the no-show pattern
Petar's noShowShifts has crept up over the last 30 days. Open the dossier — every no-show is a Sunday morning. Conversation: 'Sunday mornings are tough — let's move you to evenings'. The pattern resolves without firing anyone.
Promoting based on data, not gut
Two candidates for the head-server role. Their dossiers show identical avg tickets, but one has 92% on-time vs the other's 78%. The first gets the promotion; the second gets coaching on punctuality before being reconsidered.
Voided items signal training need
A new kitchen hire has voidedItemCount 3× the team average. Most voids are wrong-cooked steaks. Conversation: 'Let's run through the doneness chart together' — voids drop to team average over two weeks.
Avg-ticket leaderboard
Every venue has the server who upsells naturally and the one who doesn't. The avgTicketCents column ranks them. The top server's habits (recommending the chef's special, suggesting a side) get coached into the rest of the team.
Self-coaching via My Stats
Staff see their own stats and self-correct without manager intervention. A waiter notices their Tuesday avg ticket dropped — they start mentioning the new pasta dish; the average recovers. Improvement happens without a coaching meeting.
Per-staff metrics from data you already have
Most restaurant analytics platforms aggregate at the venue level — total covers, total revenue, total tickets — and stop there. The hard step is going from venue averages to per-staff insight, because that requires a staff-attribution column on every order. Ordering.Tools has had Order.assignedWaiterId since the waiter module shipped, so the per-staff roll-up is a SQL group-by, not a new instrumentation project. Add ClockEvent for hours, OrderFeedback for ratings, and StaffShiftAssignment for on-time classification, and you have a complete dossier with no new sensors.
Why nightly roll-up beats live computation
Computing per-staff metrics live on every dashboard load means a 50-staff venue's home page does a 50-row aggregation across 30 days of orders — every page load. That's slow even with indexes, and it scales badly. Nightly roll-up writes one StaffMetricsDaily row per (venue, staff, date) and dashboards read those rows directly. P95 dossier load times drop from seconds to milliseconds, the database load drops by an order of magnitude, and the data is exactly as fresh as it needs to be (yesterday's numbers, computed at 03:00 UTC).
On-time classification, fairly
There's a tension between being lenient (30 minutes late = on-time) and being strict (1 minute late = late). Different cultures, different roles. Ordering.Tools defaults to 5 minutes — generous enough that traffic and bus-stop arithmetic don't tag good workers as late, strict enough that consistent 20-minute late starts get flagged. The threshold is venue-configurable. The classification is rolling — one bad day doesn't ruin a 30-day average — and time-off-approved no-shows don't count, by design.
Read-only by design — coaching not surveillance
Editable performance metrics breed distrust. If a manager can 'fix' a low-rated day to look better, staff stop trusting the dashboard and start asking 'what was the real number?'. Ordering.Tools exposes the metrics as read-only — the only way to change them is the replay endpoint that re-computes from raw events. Raw events themselves are append-only (ClockEvent has the MANUAL_ADJUST pattern; orders aren't editable post-completion). The dashboard is what the data says happened, not a manager's interpretation.
Coach with data, not anecdote
Per-staff dossiers powered by your existing order data. Premium feature, included in Staff Management.
Related features
Other tools restaurants use alongside this one.
Set hourly rates per staff member, let them clock in from their phone with optional location verification, and export the timesheet to CSV or XLSX in one click. Every wage change is versioned; every clock event is append-only; every adjustment leaves an audit trail.
Learn moreOpen a tip pool for a period, define percentage splits per role (60% servers / 30% kitchen / 10% bar), and the platform distributes the total across staff in proportion to their clocked hours in each role. One transaction, one audit row, zero spreadsheets.
Learn moreCompliant report generation for Bulgarian employers — pull hours from clock events, apply the year's official insurance and tax rates, and download files ready for the NRA portal and your bank.
Learn moreUpload once, get notified before they expire. Manager-uploaded only (anti social-engineering); staff see their own copies on their phone; expiry watcher pages you 30/14/3 days out.
Learn more